
SNOW PROFILES AND SNOWPACK TESTS
WHAT TAKING A LOOK AT THE SNOWPACK CAN REVEAL
Anyone out in the backcountry in winter has to deal with avalanche danger. There are many approaches to this. In addition to broad, general rules of conduct and algorithm-based methods, it is worth also taking a look directly at the snowpack. This can provide valuable information, e.g. if there is a weak layer, how easily it can be stressed and how well a crack can propagate in this weak layer. This information can be gained from snow profiles and using snowpack tests, for example the CT (compression test) or ECT (extended column test). THE CT primarily helps you find the weak layer and gives you an indication of the likelihood of release. THE ECT provides additional information about how well crack propagation works within the snowpack.
This way, you can use your own observations in the field to evaluate how volatile the avalanche problem indicated in the avalanche bulletin really is. For persistent weak layers in particular, often the only thing that helps is a look at the snowpack. Because despite avalanche bulletins becoming more and more precise and naming even small-scale dangers in tour areas, the local danger on the individual slope can deviate significantly from the regional danger level.
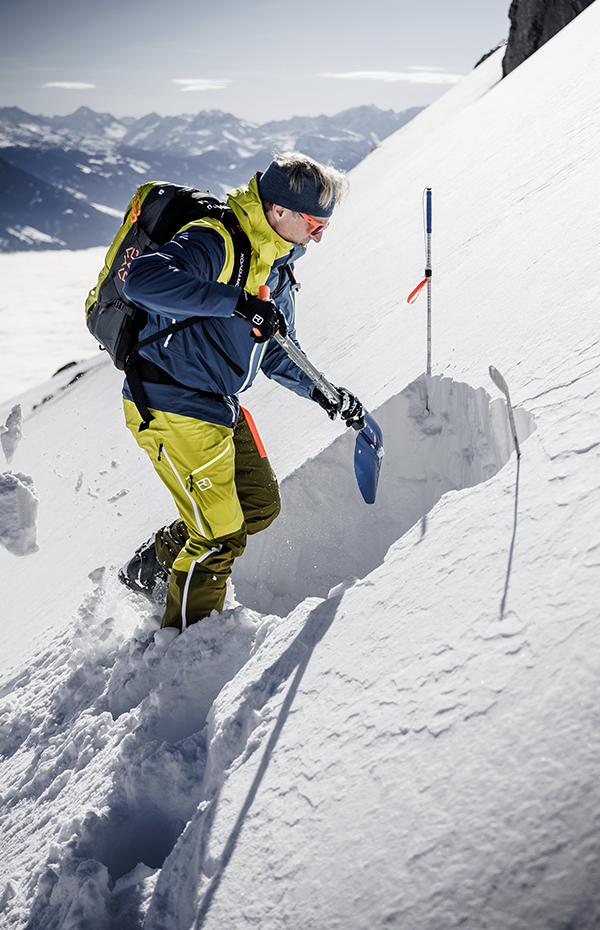
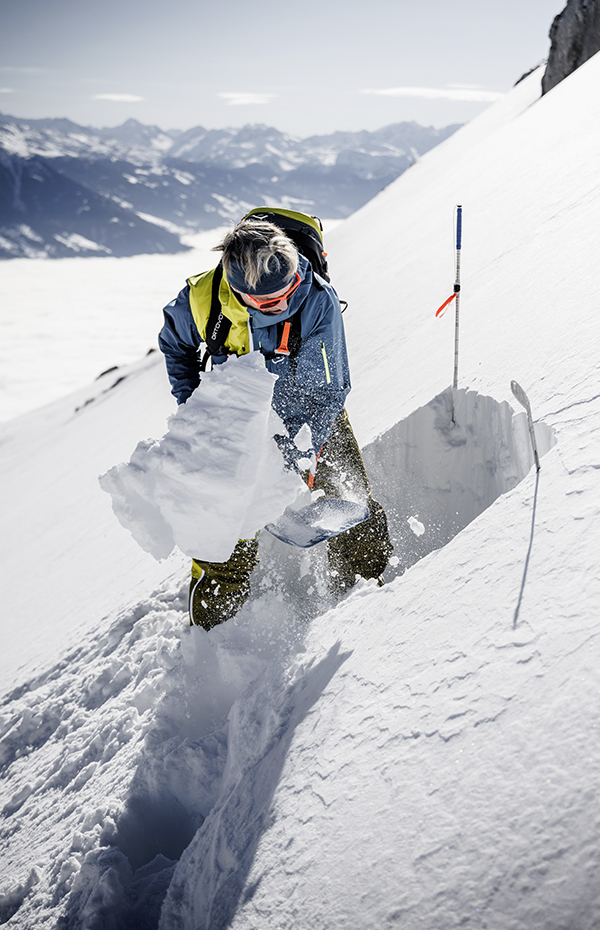
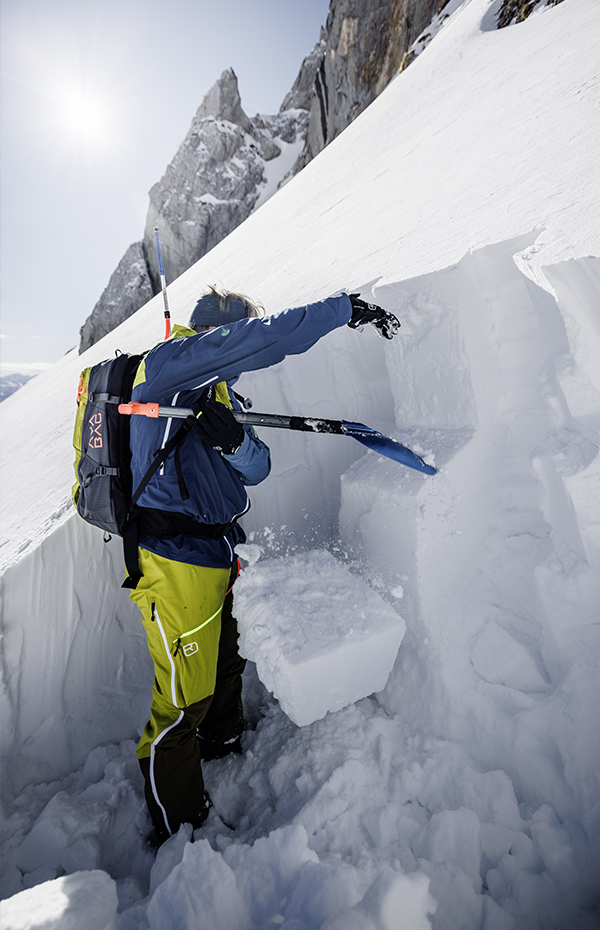
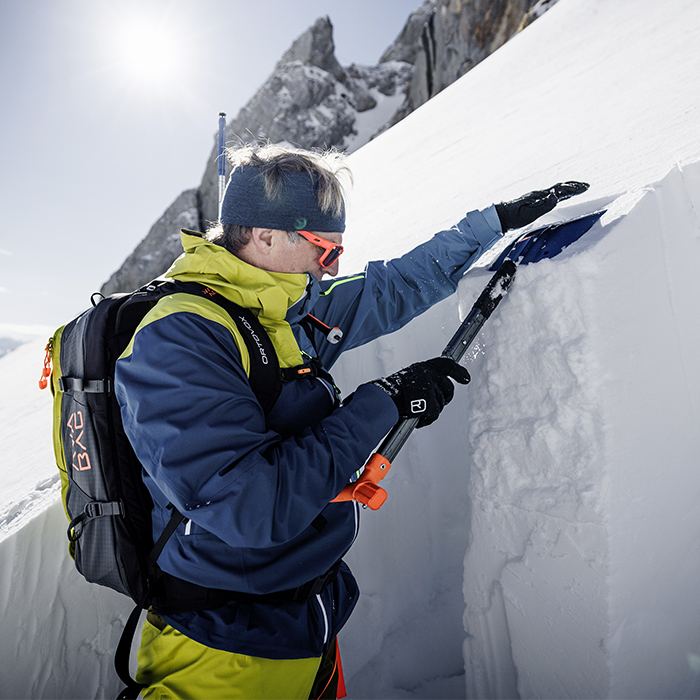
CREATING A SNOW PROFILE
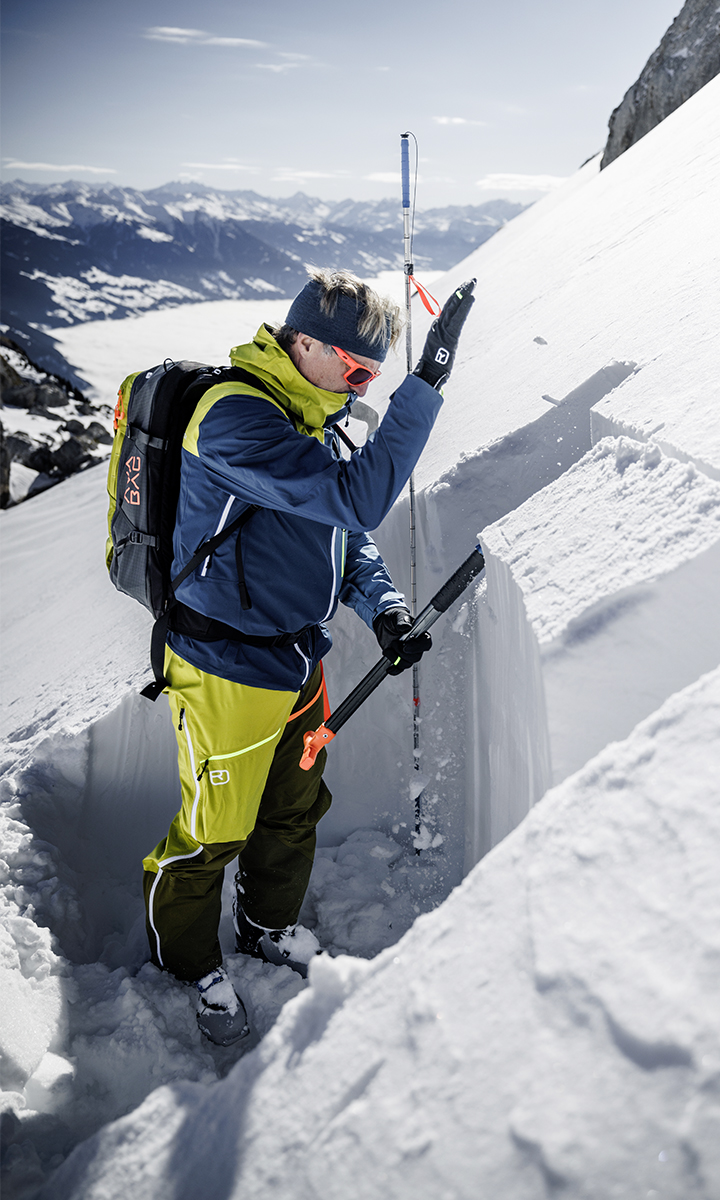
If the avalanche situation is unclear – as is generally the case with persistent weak layers – or the general danger level is significantly high, it’s worth taking a look at the snowpack. This requires a lot of knowledge and the right training. In an ideal situation, you would have both and would be able to see the big picture, understand processes within the snowpack and form your own picture of the snowpack situation. As always: Practice makes perfect. With the right equipment and some practice, a snowpack test takes no more than five minutes and is thus possible on any tour.
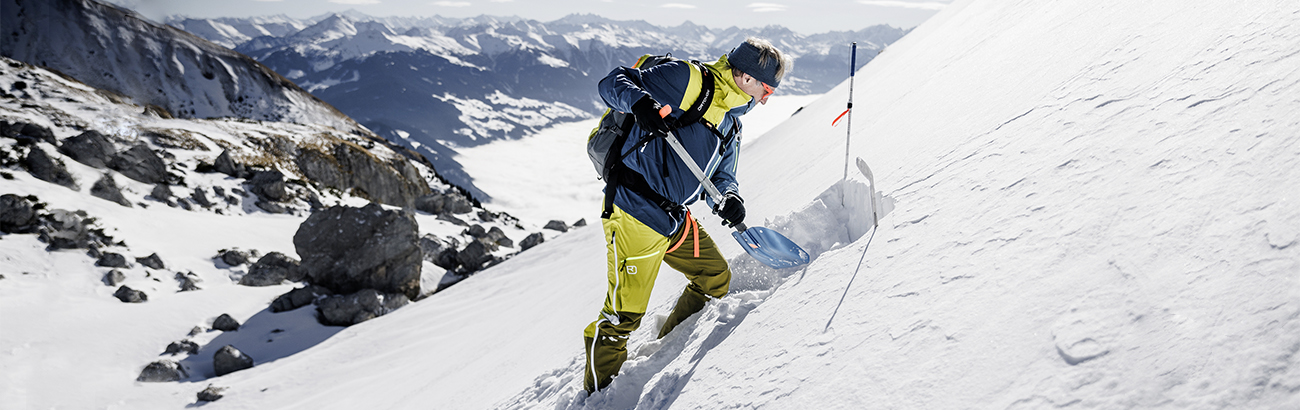
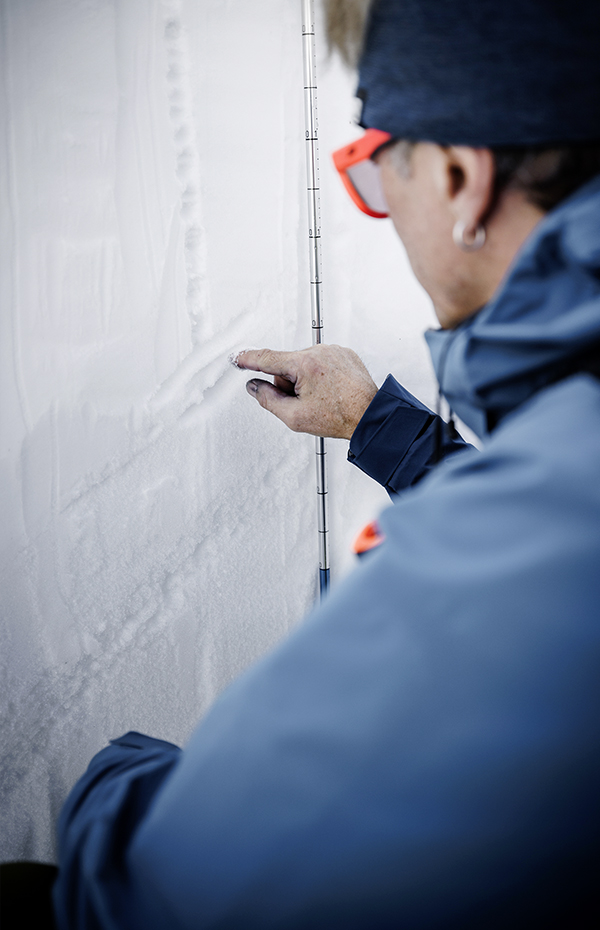
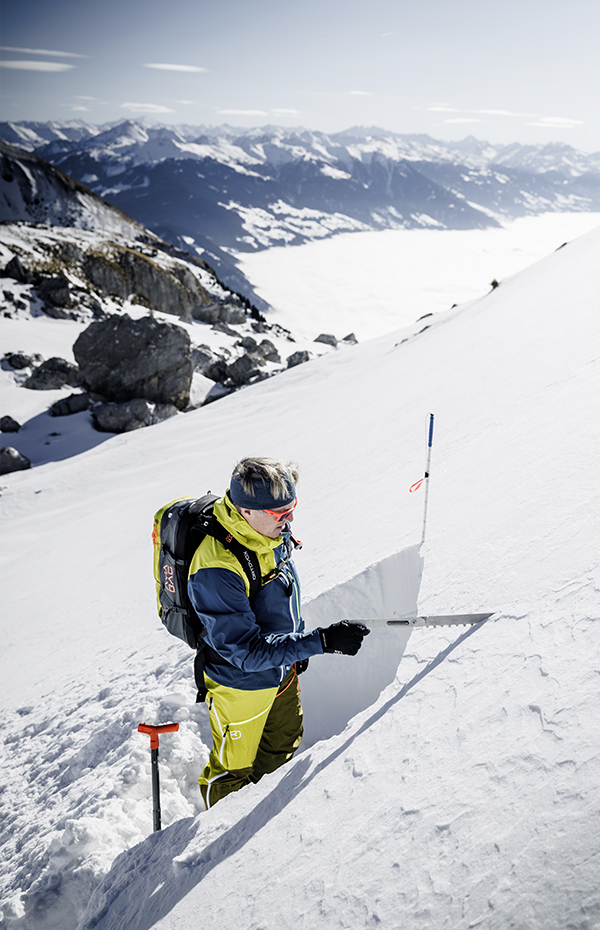
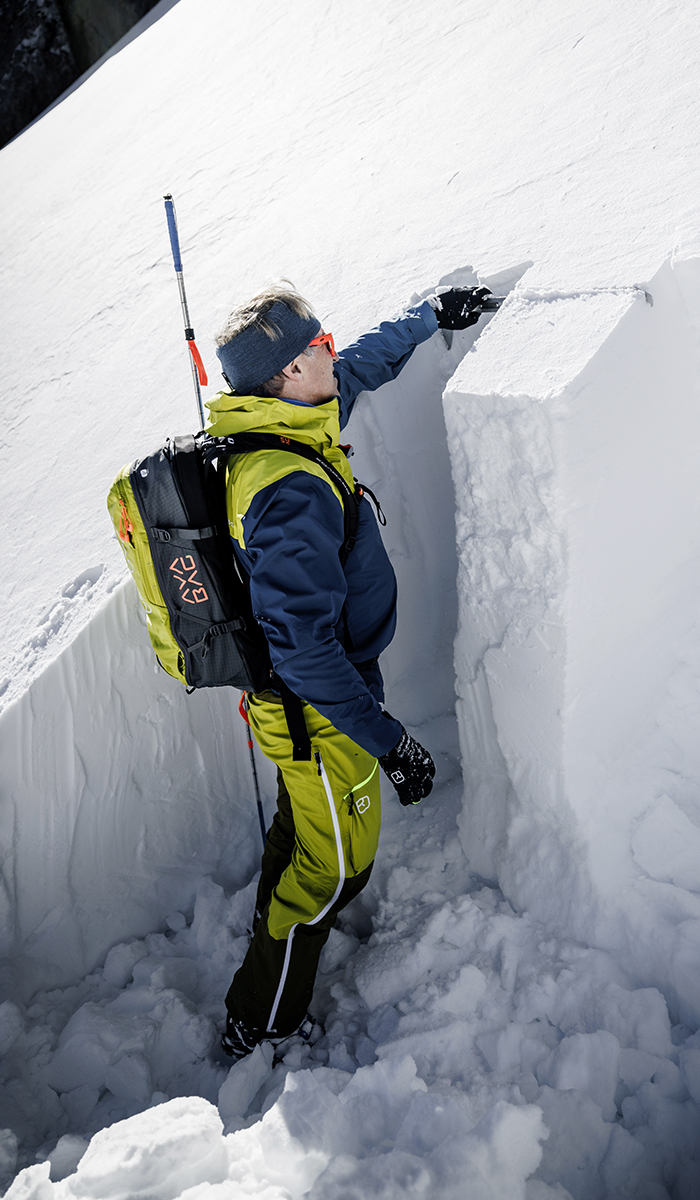
THE RIGHT WAY TO SET UP A SNOW PROFILE
A snow profile is only ever as good as its location, or in other words: It has to be representative of the terrain you require information about – so made on a slope with the same aspect, elevation and terrain features as the slopes avalanche bulletin has reported dangers on, or that you are traveling on. It’s no use making a profile in tracked terrain.
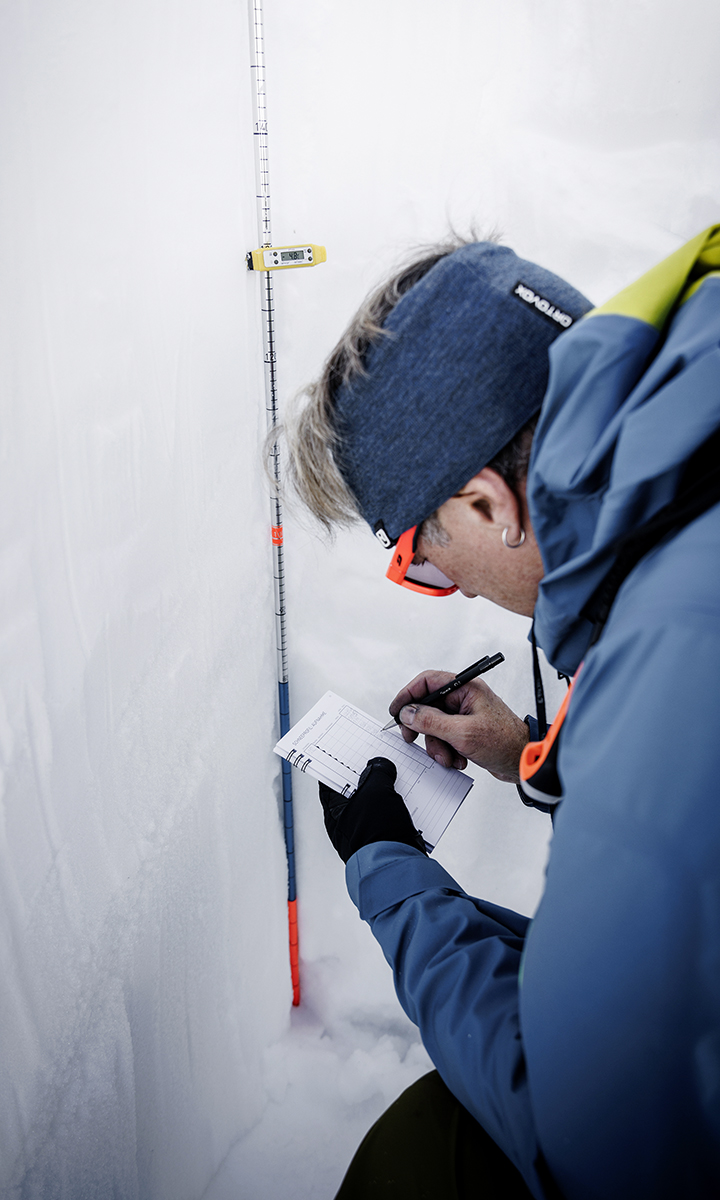
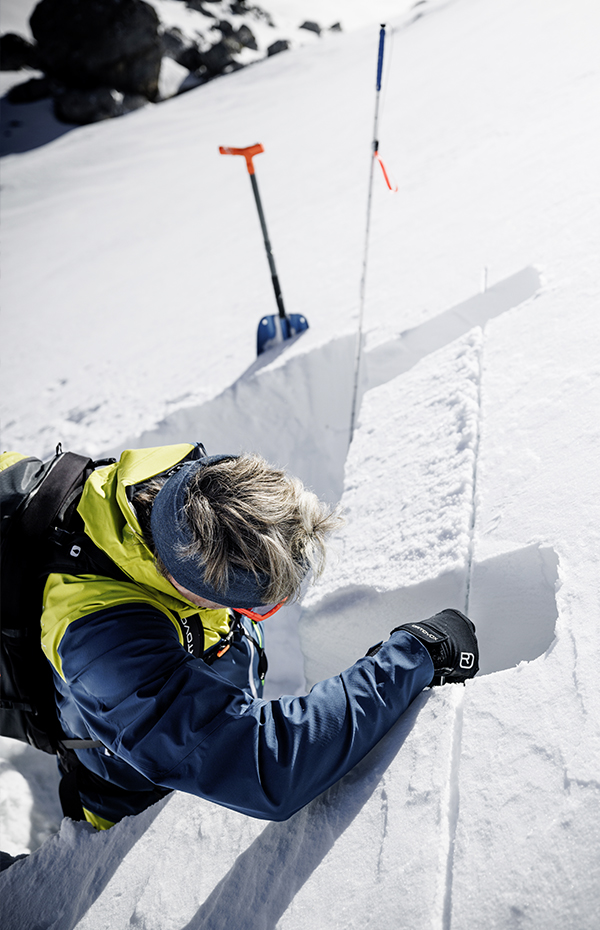
There is a lot to be considered when carrying out and documenting a snow profile.

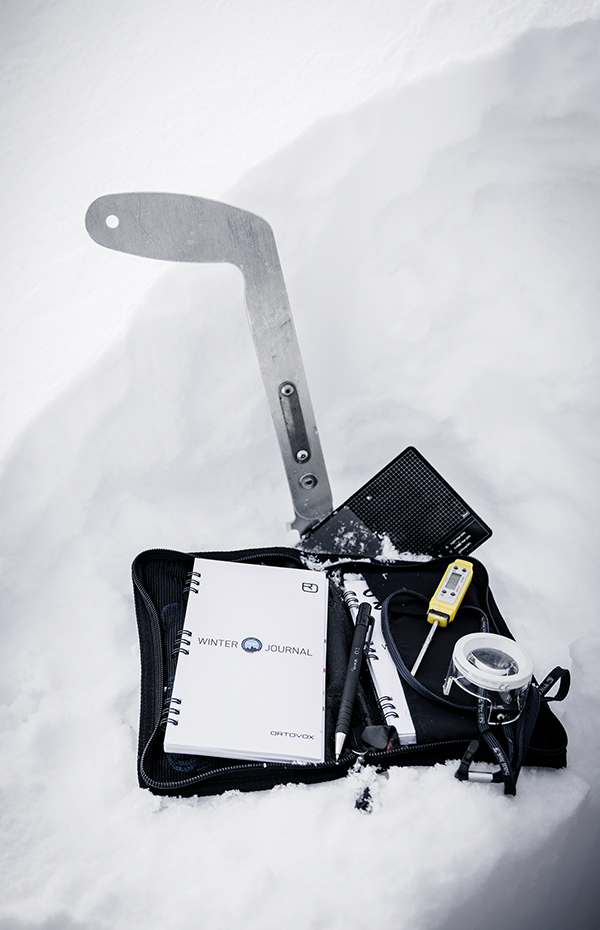
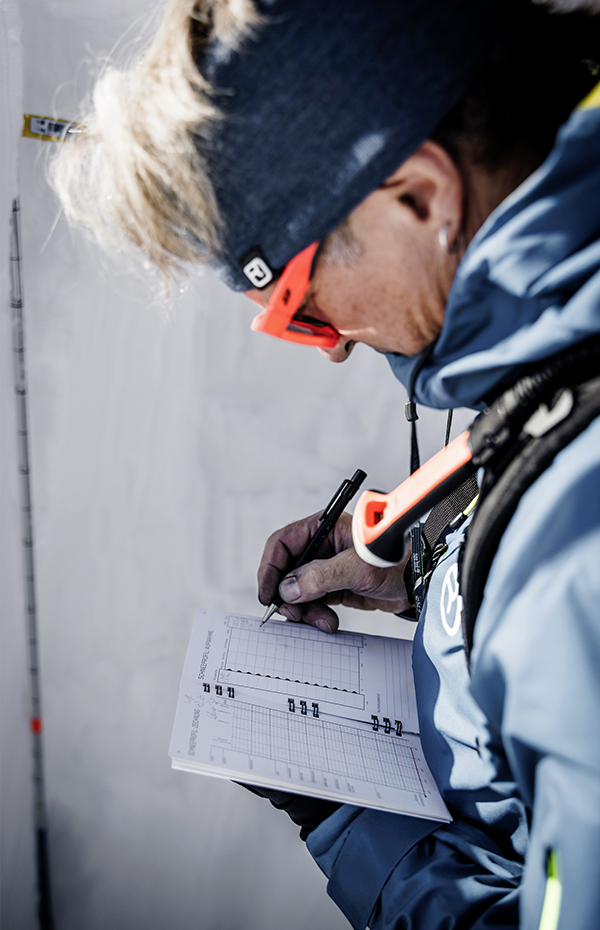
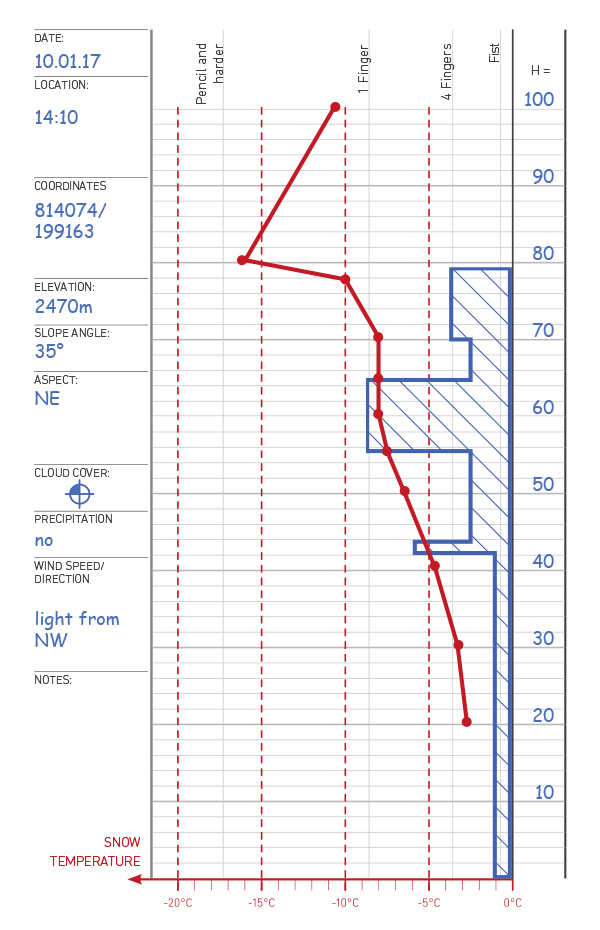
With the help of a template, known as a snow profile chart, you can quickly document the profile data in an organized way. In order to create a clear overview of the snowpack at the end, you can transfer your collected data into a snow profile program such as the Austrian Avalanche Warning Services’ LAWIS database (www.lawis.at) when you get home. There, the data is organized into a snow profile graph and made freely available online so that other winter athletes can include this important information in their tour plans. The following information is included in the snow profile chart:
With the help of a template, known as a snow profile chart, you can quickly document the profile data in an organized way. In order to create a clear overview of the snowpack at the end, you can transfer your collected data into a snow profile program such as the Austrian Avalanche Warning Services’ LAWIS database (www.lawis.at) when you get home. There, the data is organized into a snow profile graph and made freely available online so that other winter athletes can include this important information in their tour plans. The following information is included in the snow profile chart:
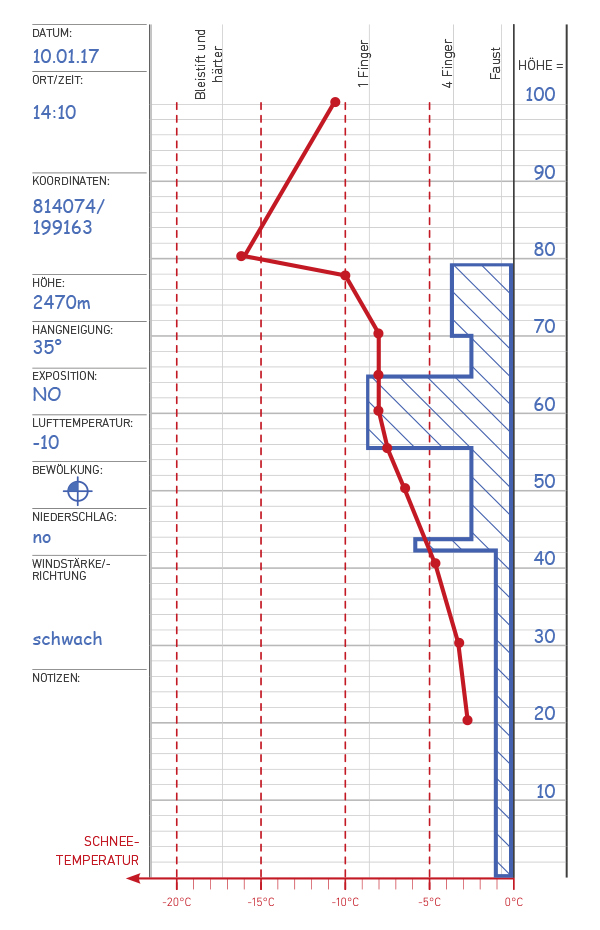
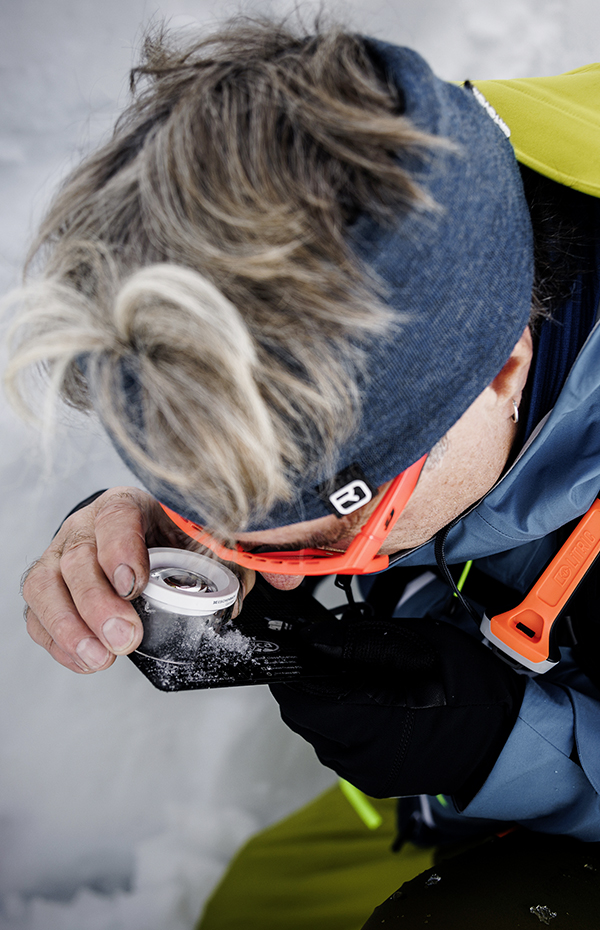
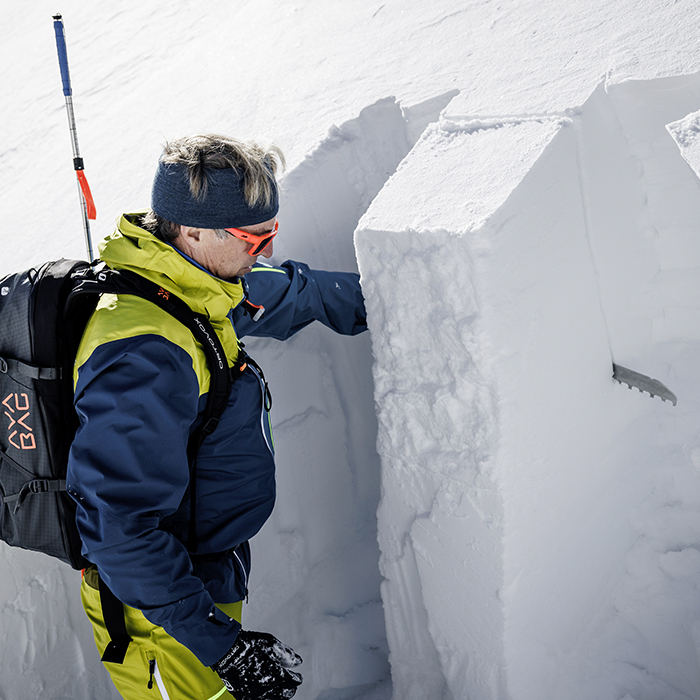
SYMBOLS AND DESCRIPTIONS IN THE SNOW PROFILE
When you read a standard snow profile, you will be confronted with very much specialist terminology and symbols. The good news: It’s less complicated than it seems at first glance. Because all of the profiles in the LAWIS database employed by the Austrian Avalanche Warning Services and similar organizations use the same symbols for snow grains and crystals and uniform descriptions of hardness and grain size.
However, interpreting a snow profile requires a great deal of knowledge and experience. There are interpretation aids to help you correctly estimate snowpack stability.

SYMBOLS AND DESCRIPTIONS IN THE SNOW PROFILE
When you read a standard snow profile, you will be confronted with very much specialist terminology and symbols. The good news: It’s less complicated than it seems at first glance. Because all of the profiles in the LAWIS database employed by the Austrian Avalanche Warning Services and similar organizations use the same symbols for snow grains and crystals and uniform descriptions of hardness and grain size.
SYMBOLS AND DESCRIPTIONS IN THE SNOW PROFILE

LAWIS DATABASE
The Austrian Avalanche Warning Services’ LAWIS database contains numerous snow profiles that are freely available. Here, you can upload and publish your own snow profile via the user interface.
You can download a matching template here.
SNOW PROFILES – AN IMPORTANT BASIS FOR THE AVALANCHE BULLETIN
Snow profiles and snowpack tests provide information that is very important for the avalanche bulletin. They provide indications of whether and where weak layers can be found, how easy these are to disturb (probability of release) and how the crack propagation situation is. Different kinds of information can be derived depending upon the test. It is important to note that a snowpack test always provides local information. Each test is only ever as good as your choice of location. Each test has to be correctly transferred to the right areas using “process thinking” (interpretation for other areas).
Snow profiles and snowpack tests are not easy, but they are the only qualitative way to gather information about the snowpack structure. In addition to weather information and feedback about avalanche releases, these form the most important basis for all avalanche warning service assessments. If, regardless of the general conduct recommendations and rigid algorithms, you want or have to do your own snowpack assessment (e.g. in areas with poor avalanche bulletin quality or with no avalanche bulletin), you must concern yourself with the analysis of the snowpack.
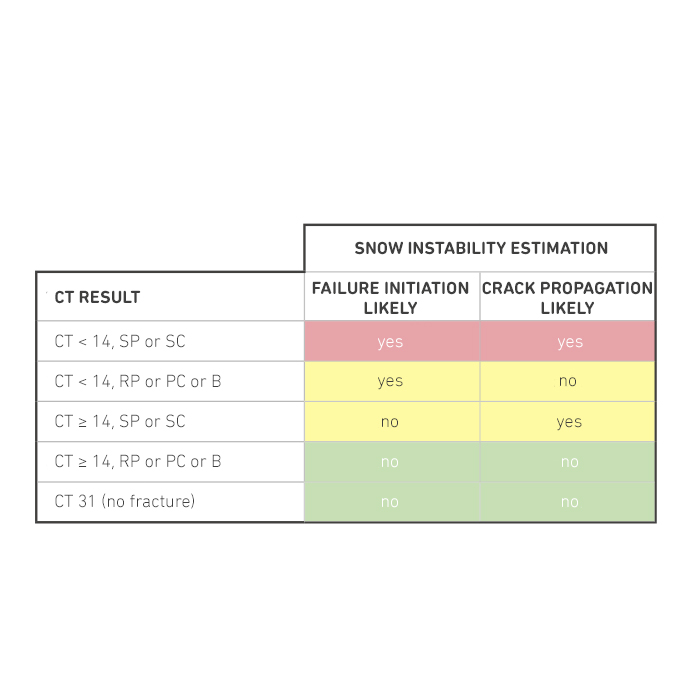
The following overview provides information about the opportunities for interpretation provided by the various snowpack tests, i.e. what you can deduce from them regarding snowpack stability:
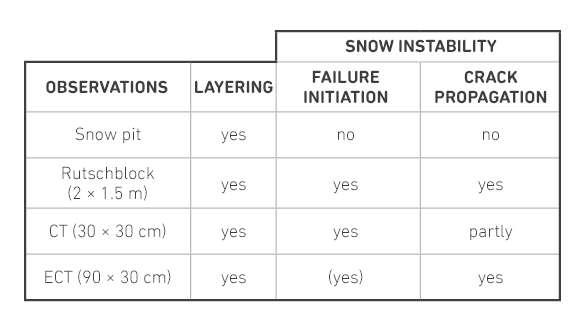
To do this, all of the Avalanche Warning services work with the ECT, the extended column test, although the Swiss services also work with the traditional but time-intensive rutschblock test. The Bavarian Avalanche Warning Services are the only ones to work with the “small block test”, a variation of the CT. Different types of information can be gained depending upon which snowpack test is done. In principle, snowpack tests can help you establish whether weak layers are present and, if so, where they can be found, how “stable” the snowpack is (i.e. how easy it is to disturb or trigger), and how well a crack can propagate.
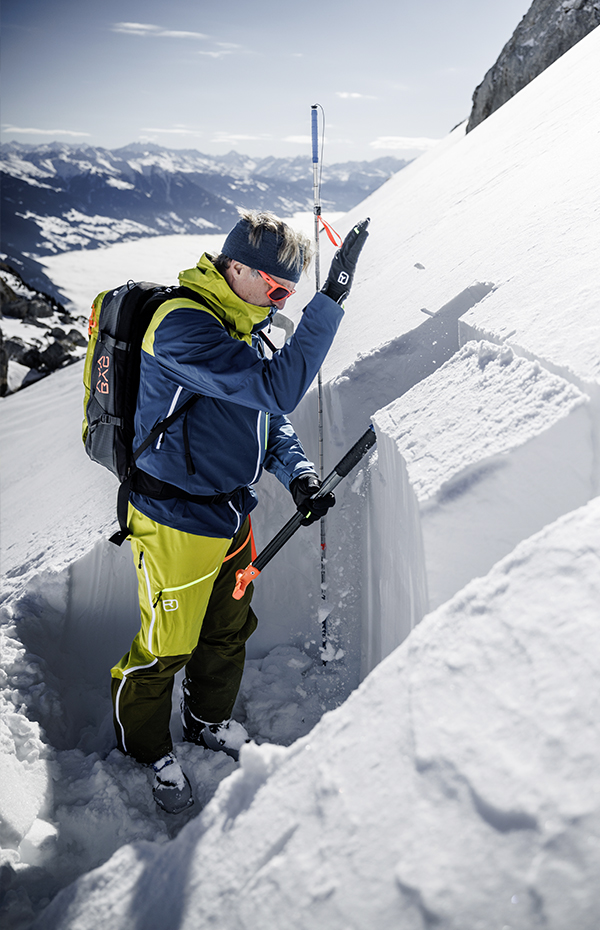
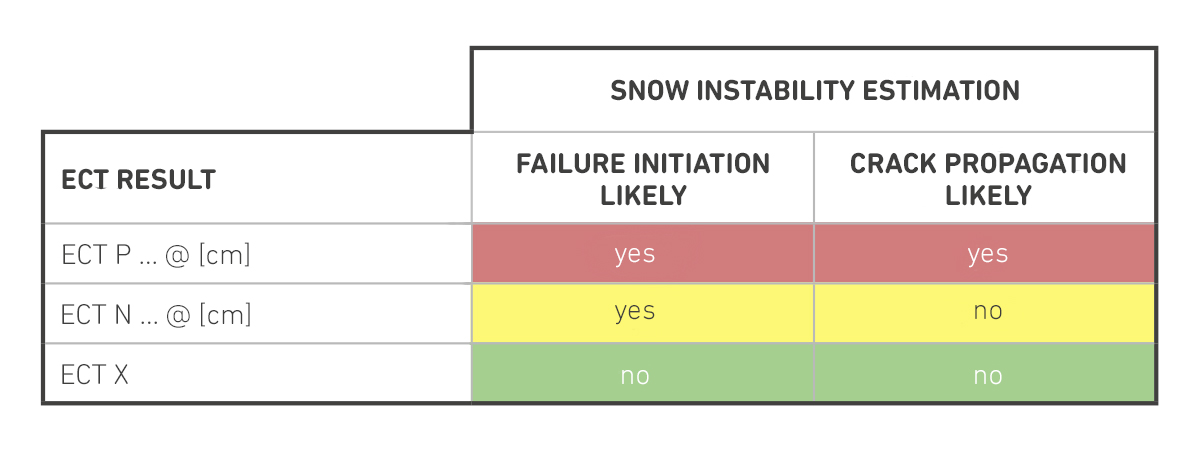
EXTENDED COLUMN TEST (ECT) – THE STANDARD TEST
The ECT is the standard test and is, therefore, used for almost all avalanche bulletins. The reason: Firstly, it can be carried out with relatively little effort; secondly, it provides you with the answers to the three core questions regarding the snowpack. These are:
- Is there a weak layer and, if so, where can it be found in the snowpack?
- How easily can it be disturbed (probability of release)?
- How well can a crack in the weak layer propagate?
Because an ECT only takes around 5 to 10 minutes, you can carry out several tests at the aspects and elevations you are interested in. This way, field testers or “reporters” can provide the avalanche bulletins with important, extensive information.

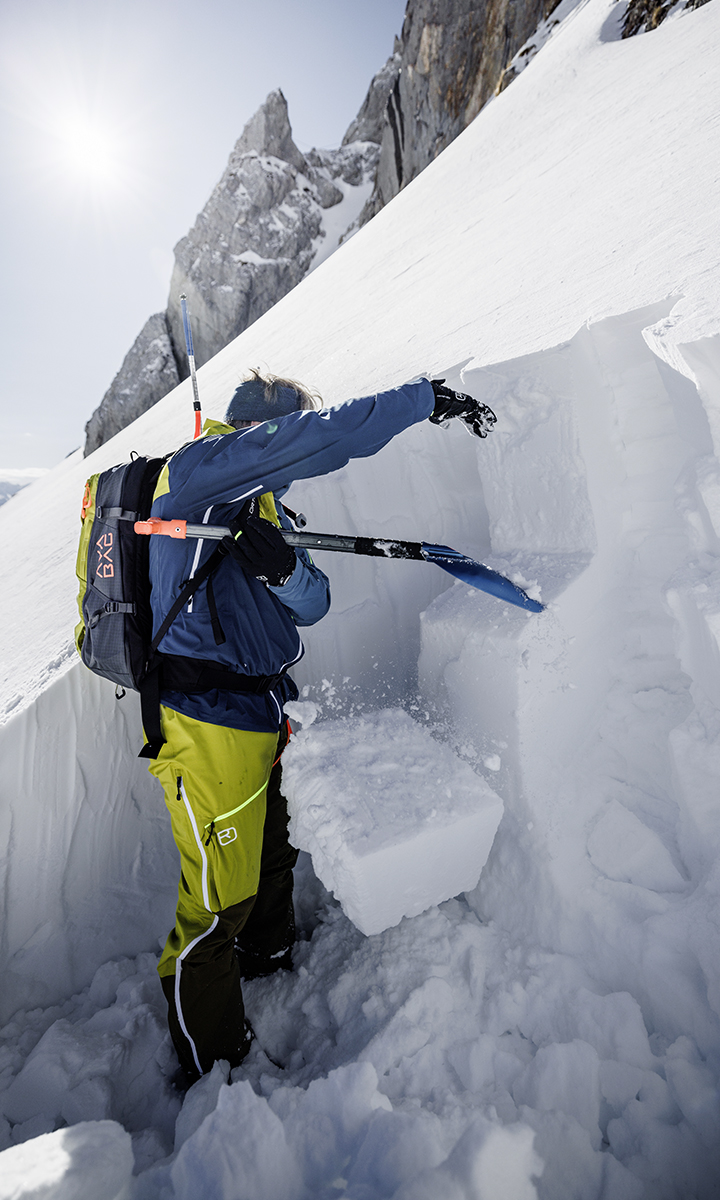
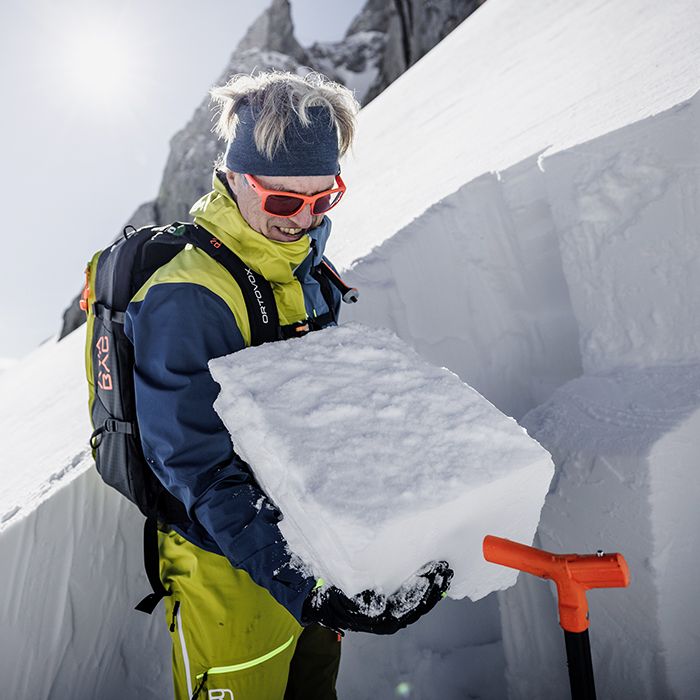
COMPRESSION TEST (CT) – THE QUICK TEST
Unlike its big brother, the ECT, the compression test can be carried out very quickly. It provides information about whether a weak layer can be found in the snowpack and, if so, where. As with the ECT, the loading step will provide a rough indication of the probability of release. However, the CT does not provide information about crack propagation. To a limited extent, this can be interpreted by looking at the shear surface.
NATURE-FRIENDLY SKI TOURING
KEEPING AN EYE ON YOUR OWN FOOTPRINT
All ski tourers and freeriders who go out into the backcountry leave tracks behind them. As outdoor athletes who passionately “consume” nature and the mountains, our goal must be to keep our footprint as small as possible. This means taking environmental responsibility for our tours, being mindful in the mountains.
Nature-friendly ski touring begins in the tour planning stage at home. Choose a tour area that requires a shorter journey to get to, create a carpool, travel using public transport or by bike, avoid high-traffic, fashionable tours or forgo a tour altogether – all of these are effective measures for protecting nature. In the mountains it is important to respect conservation zones, avoid young trees, keep far away from wildlife feeding areas and, of course, leave no trash behind. By changing our behavior, we have the power to make a big difference.
PROTACT ACADEMY LAB
There are many ways to make ski touring more nature-friendly. Our PROTACT ACADEMY LAB offers tips, tricks and tools to help you reduce your footprint in the mountains.
SAFETY ACADEMY - AVALANCHE COURSES
When you go off -piste and onto unsecured terrain, you need in-depth knowledge about how to reduce risks and perform an avalanche victim search.
Secure a place on a course and get yourself prepared for an emergency.
TOUR AND TRAINING BASIC
AIARE Avalanche Level 1
In our “Basic Training & Touring” course, our state-certified mountain guides will teach you not only how to use avalanche equipment so that you can handle a companion rescue after an avalanche, but also the essentials of sensible tour planning and how to translate your tour plan to the terrain.
VIEW COURSE DETAILSTOUR AND TRAINING ADVANCED
BASICS FOR STAYING SAFE IN DEEP SNOW (3 DAYS)
The “Advanced Training & Touring” avalanche course runs over 3 days and is ideal for freeriders and ski tourers who are already familiar with their avalanche equipment (how to use emergency equipment and simple search strategies), have already gained experience in the backcountry and wish to deepen their basic knowledge.
VIEW COURSE DETAILS